Solar Panel Installer Widnes, an independent guide / Widnes homes
Homes across Widnes, ward by ward
Widnes is nine wards and about 64,000 people, and the houses change sharply from one to the next: terraces in Appleton, post-war semis in Bankfield, 1960s and 1970s homes in Hough Green, and detached houses from the 1980s onwards in Birchfield.
Sources checked on 3 November 2026. Written by SEO Dons, which sells and fits nothing.
The nine wards in the 2021 Census
| Ward | Households | Owned | Social rent | Detached | Semi | Terraced |
|---|---|---|---|---|---|---|
| Appleton | 3,063 | 55% | 19% | 5% | 30% | 52% |
| Bankfield | 2,771 | 62% | 28% | 7% | 45% | 41% |
| Birchfield | 3,071 | 87% | 2% | 64% | 19% | 7% |
| Central & West Bank | 3,060 | 36% | 42% | 6% | 37% | 41% |
| Ditton, Hale Village & Halebank | 3,215 | 60% | 26% | 16% | 40% | 37% |
| Farnworth | 3,290 | 84% | 7% | 42% | 40% | 10% |
| Halton View | 3,338 | 64% | 19% | 13% | 40% | 33% |
| Highfield | 2,775 | 75% | 10% | 18% | 43% | 29% |
| Hough Green | 3,110 | 54% | 35% | 23% | 25% | 41% |
ONS Census 2021 by 2022 ward, summed and rounded by us. These nine wards, which include the villages of Hale and Halebank, are Halton's part of the Widnes and Halewood constituency.
When the houses were built
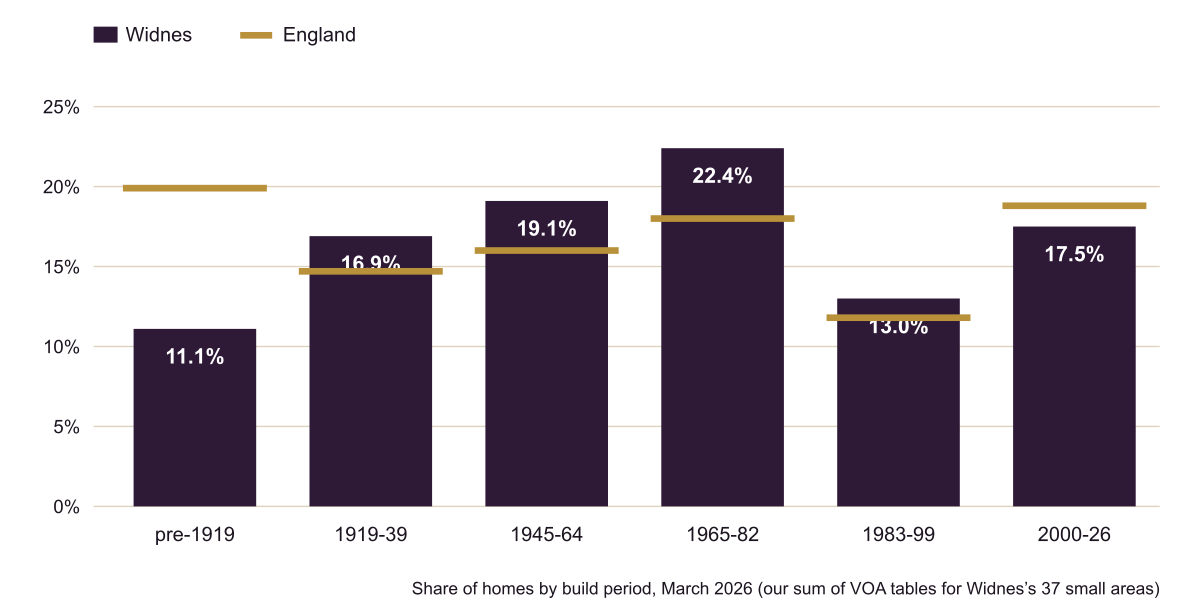
Unlike Runcorn across the river, where the New Town years dominate, Widnes's homes are spread fairly evenly across the last century. The council tax records, summed by us for the town's 37 small areas, show the ages clustering by ward:
- Appleton: about 39% built before 1919 and 28% between the wars.
- Central & West Bank: about 37% built between the wars.
- Bankfield: about 55% built 1945 to 1964.
- Hough Green: about 66% built 1965 to 1982.
- Birchfield: about 58% built 1983 to 2008.
Small areas assigned to wards by the ONS best-fit lookup, so the ward figures are approximate.
What this means for solar, ward by ward
- Appleton and Central & West Bank. The oldest streets, mostly terraced. Expect narrow slopes, chimney shade and roofs that may need work first. See Victorian terraces. In Central & West Bank 42% of households rent from a social landlord, so many decisions rest with the landlord.
- Bankfield and Halton View. Mostly semis and terraces. In Bankfield roughly 55% of homes date from 1945 to 1964, and 28% of households rent socially, so both roof age and landlord consent can come up.
- Hough Green. About two in three homes built between 1965 and 1982, and 35% of households renting socially. A roof approaching fifty years old is worth having checked before panels go on.
- Farnworth and Highfield. High home ownership, 84% and 75%, with a mix of semis and detached houses: the most straightforward ground for a standard system.
- Birchfield. 87% owner-occupied and 64% detached, much of it built from 1983 onwards. Larger roofs, so larger systems, which brings the connection route into play.
- Ditton, Hale Village & Halebank. A mix of ages and types; the Hale Village and Halebank conservation areas are here, where panels on walls facing a road need permission.
West Bank and the waterfront
West Bank sits on a peninsula with a long waterfront, south of the town centre. Halton's 2023 regeneration report describes the Mersey Gateway as breathing new life into it, and Widnes Waterfront was designated an economic development zone. In 2010 the council's infrastructure plan noted constraints in the electricity network at Widnes Waterfront; whether those still apply, and whether they would affect a home system nearby, is something only a connection application would show.
Related pages
Sources for this page
- ONS Census 2021, built-up area tables: Widnes (E63001425)
- ONS Census 2021 by ward: Widnes's nine wards, homes and tenure
- Parliamentary Constituencies Order 2023: the wards of Widnes and Halewood
- VOA council tax stock of properties, March 2026: homes by build period and type, small areas
- Cheshire Historic Towns Survey: Widnes archaeological assessment (Shaw and Clark, 2003)
- Halton Borough Council committee report, 15 February 2023: Mersey Gateway regeneration, West Bank and Widnes Waterfront
- PVGIS 5.3, European Commission Joint Research Centre: long-term yearly output for Widnes by tilt and direction
Questions about Widnes homes
Which part of Widnes is best for solar panels?
Location within the town makes almost no difference to the sunshine: PVGIS gives every part of Widnes the same yearly figure to within a fraction of a per cent. What differs from ward to ward is the kind of house, who owns it and how old the roof is.
I rent my home in Widnes. Can I have solar panels?
Only with the landlord's agreement, since the roof is theirs. If the home is rated D to G and your household qualifies, the Warm Homes: Local Grant can still help, though Halton says a private landlord may have to contribute.
Which Widnes wards have the most detached houses?
Birchfield, where 64% of households lived in a detached house in the 2021 Census, followed by Farnworth at 42%. Appleton and Bankfield have the fewest, at 5% and 7%.
A quote, an inverter or a connection question about your Widnes home?
Tell us what you are weighing up, with your Widnes postcode. The message goes to SEO-DONS LTD, which publishes this independent guide, and the answer comes back by email. Asking costs nothing and binds you to nothing.
What happens next
- Send the form; your postcode tells us which part of Widnes the roof is in.
- We read what you sent and reply by email with the figures and sources that apply.
- Whether you go ahead, and with which firm, stays your decision.